Twitter Updates

    follow me on Twitter

    Wednesday, January 25, 2012

    Sean La Rue's Weekly Newsletter: Greece is the Word Again (Vol. 10 Issue 4)

    Hello Team,

    I hope you’re having a great week!  See this week’s Real Estate Newsletter.

    I’ve also included a flyer on “Understanding the Home Appraisal Process” you can give this information to your buyers so they know the difference between the home inspection and the house appraisal.  Call me anytime if you have any questions.

    If you can't see the newsletter, or would like to view it online, use this link

    Last Week in Review: Rumors were swirling out of Europe, while inflation news was swirling here at home.

    Forecast for the Week: The second half of the week heats up with news on the housing market and the state of the economy. Plus, the Fed meets.

    View: A fee increase is coming that will impact home loan rates. Be sure to read the details below.

    Image001
    Last Week in Review

    Image002

    It's almost all Greek to me. Last week, more news from Greece hit the wires, as did several pieces of inflation news here at home. Read on to learn what happened, and what the impact was on home loan rates.

    Image003
    First, it's important to remember that back in October, a deal called for Bondholders to "accept" a 50% haircut on the face value of the Greek debt. Last week, rumors about this amount were swirling, saying that Greece is close to a deal that would entail a 68% haircut on the face value of their debt. And if that's not concern enough, a larger issue remains.

    After the proposed austerity measures, wage cuts, and tax increases are instituted, will Greece - not to mention Italy, Portugal, and other struggling economies - be able to "grow" their way out of debt? Given that the World Bank lowered its 2012 global growth forecast to 2.5% from last summer's estimate of 3.6%, the odds sure seem tough. This is an important story to watch as the year unfolds.

    Here at home, inflation was in the news twice last week...and the results were mixed. On Wednesday, the wholesale inflation measuring Core Producer Price Index (PPI) came in hot, elevating the year-over-year Core PPI rate to a lofty 3%...the highest since April 2009. Meanwhile, Thursday's Core Consumer Price Index (CPI) was inline with expectations and tame overall, though it is worth noting that the 2.2% Core CPI year-over-year reading is near the upper end of the Fed's tolerance level.

    Remember, inflation is the archenemy of Bonds and home loan rates, like Kryptonite to Superman. That's because inflation erodes the value of the fixed return provided by a Bond, which causes home loan rates to rise. It will be interesting to see what - if anything - the Fed says about inflation after it's regularly scheduled meeting of the Federal Open Market Committee this week...as any talk or sign of inflation can move the markets and impact rates.

    Even with all the news last week, it's still a great time to purchase or refinance a home. Let me know if I can answer any questions at all for you or your clients.

    Image001
    Forecast for the Week

    Image002

    The reports that will be released this week will carry some weight:

    • We'll see a double dose of housing news with Pending Home Sales on Wednesday and New Home Sales on Thursday.
    • As usual, Initial Jobless Claims will be released on Thursday. Last week's read came in at 352,000, a drop of 50,000. That's the biggest decline since September 2005!
    • We'll also see two important reports that will show us how the economy is doing. Thursday brings the Durable Goods Report, which gives us a read on big ticket items. This will be followed by the first reading on Gross Domestic Product (GDP) for the Fourth Quarter of 2011 on Friday.
    • Finally, Consumer Sentiment will also be released on Friday.

    In addition to those reports, the Federal Open Market Committee will hold a two-day meeting this week. The meeting will begin January 24 and end with a policy statement at 12:30 pm ET on January 25. There is no chance of a rate hike, but I will be listening for any hint of a third round of Quantitative Easing (QE3).

    Remember: Weak economic news normally causes money to flow out of Stocks and into Bonds, helping Bonds and home loan rates improve, while strong economic news normally has the opposite result.

    As you can see in the chart below, some encouraging economic and company earnings news last week helped halt the improving trend Bonds had been seeing. I'll continue to monitor this situation.

    Chart: Fannie Mae 3.5% Mortgage Bond (Friday Jan 20, 2012)

    The Mortgage Market Guide View...

    Image002

    Fee Increase to Impact Home Loans

    In December 2011, Congress reached a last-minute deal to fund the payroll tax cut extension. The payroll tax extension will provide a 2% tax reduction for individuals making up to $106,800, so the tax extension will be very helpful for many Americans who are struggling during these tough economic times. But like so many things in our tangled economy, there's a flip side. In this case, the tax cut deal has a rippling effect that will impact the mortgage world.

    Here's what's happening and what it means to home loan rates:

    What is happening and why? To put it bluntly, the passage of the payroll tax cut extension is being funded via a mandate to Fannie Mae and Freddie Mac (the nation's largest providers of mortgage money) to increase their guarantee fees or "g-fee's" by at least 10 basis points on the rate. So rather than giving a par rate of 4.00%, for example, the par rate is now increased by at least 10 basis points, or approximately 4.10%. But as you probably know…home loan rates are priced and offered in .125% increments, so this will most likely impact the consumer by .125% in rate. Whether you agree or not on the politics behind this cost being passed along to folks who are taking out mortgages, the Congressional Budget Office recently estimated that the increase will ultimately pay for about $35.7 Billion of the cost of the payroll tax extension.

    What exactly is this "g-fee"? The guarantee fee or "g-fee" is an amount charged by mortgage-backed securities (MBS) providers, like Freddie Mac and Fannie Mae, to help protect against credit-related losses in the overall mortgage portfolio. In other words, it acts a lot like insurance and helps lower the overall risk…which means home loans can be offered at terrific interest rates to borrowers that have good - but not perfect - credit.

    What exactly is the impact of the rate increase? For example, for a $200,000 home loan, the increased g-fee (assuming a .125% increase in rate) would equate to $250 more per year in interest, or $7,500 more over 30 years. Someone buying or refinancing a home can certainly choose to buy down the cost with cash up front - but most folks will not do this.

    Who will this impact? The change will impact all new borrowers of Fannie Mae and Freddie Mac loans. The bill will also impact Federal Housing Administration (FHA) loans by increasing the annual mortgage insurance premium that borrowers pay by one-tenth of a percent.

    When will it start? Officially, the increase to guarantee fees will begin on April 1, 2012. However, the increase is already starting to be seen in rate sheets right now, since home loans being originated now will likely not be closed, pooled and securitized until April…and therefore will need the increased g-fee priced in earlier.

    How long will this be in effect? The increase will be effective through October 1, 2021.

    The bottom line is that the g-fees will be going up…and this will impact homebuyers looking to obtain a home loan through Fannie Mae, Freddie Mac and FHA.

    The good news is that home loan rates are still at historic lows right now, and it's a great time to purchase a new home or refinance. If you or anyone you know has any questions, please call or email!

    Economic Calendar for the Week of January 23 - January 27

    Image004

    Understanding The Home Appraisal Process.pdf Download this file

    Posted via email from Sean La Rue's Posterous

    Real Estate Market Stats

    1. In 2011, 37% of homebuyers were first-time buyers - which was down from 50% in 2010.

    2. Last year, 88% of homebuyers used the Internet to search for a home. That number was down slightly from a high of 90% in 2009.

    3. The typical homebuyer searched for 12 weeks and viewed 12 homes.

    4. The number of buyers who purchased their home through a real estate agent or broker climbed to 89% - a share that has steadily increased from 69% in 2001.

    5. Nearly 1 out of 4 buyers said the application and approval process was "somewhat more difficult" than expected…and 16% reported it was "much more difficult" than expected.

    6. About half of home sellers traded up to a larger and more expensive home…and 60% traded up to a new home.

    7. The top 3 factors influencing neighborhood choice were: the quality of the neighborhood, the convenience to job, and the overall affordability of homes.

    8. The typical seller lived in their home for 9 years. That number has increased from 6 years in 2007.

    9. Although 61% of sellers said they reduced their asking price at least once, the average home sold for 95% of the listing price.

    10. Only 10% of sellers sold their homes without the assistance of a real estate agent. Of those people, 40% knew the buyer prior to the sale.

    11. The typical "for sale by owner" home sold for $150,000 compared to $215,000 for the average agent-assisted home sale.

    Posted via email from Sean La Rue's Posterous

    Tuesday, January 17, 2012

    Sean La Rue's Weekly Newsletter: Happy Sentiments Abound Vol 10 Issue 3

    Happy Tuesday!

    Hope you’re off to a great week.  Attached is a flyer you can use to help your buyers understand the purchase process.  Keep this information and save it for your buyers when the time comes.  It’s a very useful and powerful tool to show your clients the “road map” towards closing.  I’m looking forward to an awesome 2012 and I want to help you close more business this year and reach your goals.  Please let me know what I can do to support you.

    This is this weeks Newsletter… If you can't see the newsletter, or would like to view it online, use this link

    If you have received this newsletter indirectly and would like to be added to our weekly distribution list, use this link

    Last Week in Review: Consumers are feeling good, but how good was last week's news?

    Forecast for the Week: It's a holiday shortened week, but the economic calendar is full. News on manufacturing, inflation, and housing is ahead.

    View: Wondering what the housing trends for 2012 will be? Check out 11 trends we saw in 2011.

    Image001
    Last Week in Review

    Image002

    "Happy days are here again." Milton Ager and Jack Yellen. And while it seems that consumers are certainly feeling happier, not everything that happened last week was cause for song.

    Image003
    There was good news last Friday, as the first look at Consumer Sentiment for January came in at 74.0, which is the highest level since May 2011. However, there was also news last week that the holiday shopping season may not have been as robust as previously thought.

    Retail Sales in December rose by a meager 0.1% from 0.4% in November, and when stripping out autos, sales actually fell 0.2%. Why did this happen? It seems that steep holiday discounting held down the value of goods sold, so sales were big, but only because of the heavy discounting.

    The news out of Europe last week also wasn't too happy. German Chancellor Angela Merkel and International Monetary Fund Managing Director Christine Lagarde met to discuss and finalize the debt restructuring deal for Greece. Back in October, a deal called for Bondholders to "accept" a 50% haircut on the face value of the Greek debt - but as creditors and authorities have started to forge a final deal, the actual haircut back to investors is looking quite likely to be larger than 50%. This is simply because worsening financial conditions in the Greek economy make paying the debt back with "just" a 50% haircut highly unlikely...maybe impossible. What's more, the next reasonable question to consider is will Ireland, Portugal and even Italy ask for a similar haircut or deal on what may be unsustainable debt in their countries?

    The happy news is that these problems are finally being addressed to make things better in the future. And in the short term, the uncertainty should keep money flowing into the relative safe haven of the US Dollar and US Bonds - including Mortgage Bonds, to which home loan rates are tied. In addition, Mortgage Bonds continue to be supported by the Fed's purchases, which are also helping to keep home loan rates at record low levels.

    All of this means that now continues to remain a great time to purchase or refinance a home. Let me know if I can answer any questions at all for you or your clients.

    Image001
    Forecast for the Week

    Image002

    Despite the Bond Markets and all Capital Markets being closed on Monday in observance of Martin Luther King, Jr. Day, the rest of the week's economic calendar is full:

    • Manufacturing strong? The week's economic data kicks off on Tuesday with a manufacturing indicator from New York's Empire State Index for January. In addition, the Philadelphia Fed Index for January will be released on Thursday. Last month, both reports reached their highest levels in months. Remember: The Stock Market likes to see healthy economic growth because that translates to higher corporate profits. However, the Bond market prefers a moderate growth environment that won't generate inflationary pressures.
    • Speaking of inflation… We'll see inflation reports on the wholesale level in the Producer Price Index on Wednesday, followed by the Consumer Price Index on Thursday. Inflation has remained tame…and Bondholders will be closely watching these two indicators for any signs of an uptick.
    • Back on track this week? Initial Jobless Claims will be released as usual on Thursday. Last week's number showed an uptick in claims and broke the recent trend of decreasing claims. However, the rise could have been due in part to layoffs of seasonal holiday workers. So the markets will be watching to see if this report gets back on track with the recent positive trend.
    • No place like home! Housing data in the form of Housing Starts, Building Permits and Existing Home Sales will all be reported this week. Housing continues to troll around low levels despite record low home loan rates.

    Remember: Weak economic news normally causes money to flow out of Stocks and into Bonds, helping Bonds and home loan rates improve, while strong economic news normally has the opposite result.

    As you can see in the chart below, Bonds and home loan rates are continuing their improving trend. I'll be watching this closely as we head further into the new year.

    Chart: Fannie Mae 3.5% Mortgage Bond (Friday Jan 13, 2012)

    The Mortgage Market Guide View...

    Image002

    Housing News: 11 Trends from 2011

    The National Association of Realtors® surveys homebuyers and sellers each year to uncover housing trends and monitor changes taking place in the industry. This year's report highlights a number of trends that haven't been seen in years. Here are just 11 highlights from the 2011 report.

    1. In 2011, 37% of homebuyers were first-time buyers - which was down from 50% in 2010.

    2. Last year, 88% of homebuyers used the Internet to search for a home. That number was down slightly from a high of 90% in 2009.

    3. The typical homebuyer searched for 12 weeks and viewed 12 homes.

    4. The number of buyers who purchased their home through a real estate agent or broker climbed to 89% - a share that has steadily increased from 69% in 2001.

    5. Nearly 1 out of 4 buyers said the application and approval process was "somewhat more difficult" than expected…and 16% reported it was "much more difficult" than expected.

    6. About half of home sellers traded up to a larger and more expensive home…and 60% traded up to a new home.

    7. The top 3 factors influencing neighborhood choice were: the quality of the neighborhood, the convenience to job, and the overall affordability of homes.

    8. The typical seller lived in their home for 9 years. That number has increased from 6 years in 2007.

    9. Although 61% of sellers said they reduced their asking price at least once, the average home sold for 95% of the listing price.

    10. Only 10% of sellers sold their homes without the assistance of a real estate agent. Of those people, 40% knew the buyer prior to the sale.

    11. The typical "for sale by owner" home sold for $150,000 compared to $215,000 for the average agent-assisted home sale.

    All Contents ©2012 The National Association of Realtors®.

    Economic Calendar for the Week of January 16 - January 20

    Date

    ET

    Economic Report

    For

    Estimate

    Actual

    Prior

    pppp

    Posted via email from Sean La Rue's Posterous

    Friday, January 13, 2012

    Foreigner Concert at Agua Caliente

    IMG_4743.MOV Watch on Posterous

    Rock on Foreigner!

    Posted via email from Sean La Rue's Posterous

    [MND NewsWire] - Foreclosure Activity Down for Month, Quarter, and Year

    This email was sent to you by:
    Sean | Mortgage News Daily

    Foreclosure activity hit its lowest level in four years in 2011, decreasing by a third from the previous year according to data released today by RealtyTrac. One in every 69 housing units in the U.S. was subject to a filing during the year, 1.45 percent of the total housing stock. Activity also decreased for the month of December and for the fourth quarter of 2011 according to the U.S. Foreclosure Market Report covering the three periods which was released by the Irvine, California company this morning.

    A total of 1,887,777 properties were subject to a foreclosure filing during the year. This was a decrease of 34 percent from 2010 and was 33 percent below the 2009 total and 19 percent below activity in 2008. Total U.S. foreclosure activity and the U.S. foreclosure rate in 2011 were both at their lowest annual level since 2007.

    RealtyTrac, which states that its business model is to provide technology solutions and education resources to facilitate buying, selling and investing in real estate, did not attribute the declining activity to an overall improvement in the economy and housing market, but rather to flaws in the foreclosure process. Brandon Moore, chief executive officer of RealtyTrac said, "Foreclosures were in full delay mode in 2011, resulting in a dramatic drop in foreclosure activity for the year. The lack of clarity regarding many of the documentation and legal issues plaguing the foreclosure industry means that we are continuing to see a highly dysfunctional foreclosure process that is inefficiently dealing with delinquent mortgages - particularly in states with a judicial foreclosure process.

    "There were strong signs in the second half of 2011 that lenders are finally beginning to push through some of the delayed foreclosures in select local markets. We expect that trend to continue this year, boosting foreclosure activity for 2012 higher than it was in 2011, though still below the peak of 2010."

    RealtyTrac compiles its data by tracking documents filed in all three stages of foreclosure:

    1. Notice of Default (NOD) and Lis Pendens (LIS). This is the first legal notification from a lender that the borrower on a mortgage loan has defaulted under the terms of their mortgage and the lender intends to foreclose unless the loan is brought current.

    2. Auction - Notice of Trustee Sale and Notice of Foreclosure Sale (NTS and NFS): if the borrower does not catch up on their payments the lender will file a notice of sale (the lender intends to sell the property). This notice is published in local paper and contains information pertaining to the date, time and subject property address.

    3. Real Estate Owned or REO properties : "REO" stands for "real estate owned" and typically refers to the inventory of real estate that banks and mortgage companies have foreclosed on and subsequently purchased through the foreclosure auction if there was no offer higher than the minimum bid.

    Filings in total were also down for the fourth quarter and for the month of December while activity in the component data was mixed. During the quarter there were filings on 586,133 properties, down 4 percent from the third quarter and 27 percent from the same quarter in 2010. Default notices were down 6 percent quarter-over-quarter and 22 percent year-over year while scheduled auctions rose 4 percent for the quarter but were down 32 percent from Quarter 4, 2010. REOs were down 11 percent for the quarter and 24 percent from the same period in 2010.

    Foreclosure activity hit a 49 month low in December with foreclosure filings reported on 205,024 properties during the month, one in every 222 units. This was a decrease of 9 percent from November and was 20 percent lower than one year earlier. Default notices decreased 19 percent from the previous month and were down 23 percent from December 2010; Scheduled foreclosure auctions decreased 12 percent from the previous month and were down 24 percent from December 2010; and bank repossessions (REO) increased 10 percent from the previous month but were still down 12 percent from December 2010.

    The bad news dragged on for the three states that have topped the foreclosure charts almost from the beginning. While activity was down 31 percent from 2010, more than 6 percent of the housing units in Nevada (one in 16 units) had a foreclosure filing of some type during 2011. This is the fifth year that Nevada has had the highest rate of activity in the nation. Arizona registered the second highest rate for the third year in a row, with 4.14 percent of its stock (one in 24) involved in a filing.

    While California dropped out of the top three states several times during the year, it still had the nation's third highest rate of activity for the year with one in every 31 housing units (3.19 percent) subject to a filing. Filings in December, however, were down 38 percent from the previous month. Other states with high levels of activity were Georgia, Utah, Michigan, and Florida.

    Supporting the company's assertion that the downturn in activity is a function of dysfunction, RealtyTrac reports that foreclosures during the fourth quarter took an average of 348 days to complete, up from 336 days in the third quarter and 305 days in the fourth quarter of 2010. "The length of the average foreclosure process has increased 24 percent from 281 days in the third quarter of 2010, when lenders began to re-evaluate foreclosure procedures in earnest as the result of the so-called robo-signing controversy."

    The average foreclosure process in New York has increased 37 percent during the same time period, and New York properties foreclosed in the fourth quarter took an average of 1,019 days to complete the foreclosure process - the longest of any state.

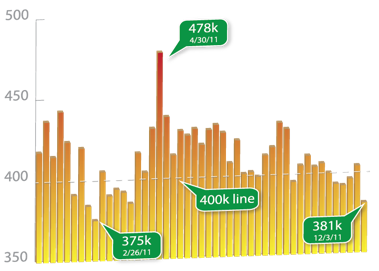
    [Image or graph removed from email. View full article with images]


    View Article: http://www.mortgagenewsdaily.com/01122012_foreclosures_realty_trac.asp
    ________________________________

    More from MND:

    * MBS Commentary: The Day Ahead: Trade Data, Consumer Sentiment, and a 3-day Weekend
    * MBS Commentary: MBS RECAP: 1/12/2012
    * Mortgage Rate Watch: Mortgage Rates: "And Now For Something Completely Similar"
    * MBS Commentary: MBS MID-DAY: 1/12/2012
    * MND NewsWire: Foreclosure Activity Down for Month, Quarter, and Year

    If you would like to opt-out of receiving email forwards from this person please click here to remove your email address.

    Forward this email: Send a copy of this story to someone you know that may want to read it.

    Posted via email from Sean La Rue's Posterous

    Wednesday, January 11, 2012

    Sean La Rue's Monthly Newsletter - What's up with this market? Vol 7 Issue 1

    Hello Friends and Family,

    You know interest rates are currently at an all-time low right now.  Find out for FREE if you can lower your monthly payments with little or no money out of pocket.  (See the newsletter below)

    A few options are:

    1. FHA Streamline – if you have had an FHA loan for more than 6 months and have an interest rate over 5.5% chances are you can refinance with no appraisal and little documentation.

    2. Conventional refinances – lower your monthly payments with a lower interest rate. Or keep your payments the same and shorten your term. 15 year fixed are incredibly low right now.  Lower the rate and lower the amount of interest you are paying over time.  Own your home free and clear faster!

    3. It’s a FREE consultation.  No obligation and you can make sure you’ve got the best terms for you and your family.

    I want to help you save money!! Call me today for your free consultation at 760-837-1488 or email me at slarue@franklinlc.com

    ***It’s a great time to purchase a home as well.  Are you currently renting?  Could you pay the same or less to own your own home?  With low interest rates and how low home prices are right now chances are you could actually save money every month by owning your own home. Find out how much you can qualify for today.  Let me know if you know someone who needs a good lender for any California home purchasers.  We all need good team members and I’d like to be yours.***

    If you can't see the newsletter, or would like to view it online, use this link

    If you have received this newsletter indirectly and would like to be added to our distribution list, use this link


    Provided to you Exclusively by Sean K. La Rue
    “Your KEY To Moving Home!”

    Sean K. La Rue

    Sean K. La Rue
    Senior Vice President
    Franklin Loan Center
    Office: 760-837-1488
    Mobile: 760-835-5663
    Fax: 800-784-9089
    Email: slarue@franklinlc.com
    Website: www.SeanLaRue.com


    Franklin Loan Center

    For the Month of January 2012 --- Vol. 7, Issue 1


    IN THIS ISSUE...  


    Despite what the Mayan calendar may say, the world probably won't come to an end in 2012. But like 2011, this coming year may bring some significant challenges here in the US...and around the world. Here are just a few important topics to keep an eye on in the new year:

    • Working for a Living – The labor market made modest improvements in 2011…but what should you expect in 2012? Here’s the answer!
    • Home Sweet Home – The housing market is still uncertain, but here’s something to celebrate!
    • What to Watch – Inflation is extremely influential. Read the article below to discover what to watch in 2012.
    • Q&A: The Bottom Line? – What’s the bottom line for 2012? The answer may surprise you!

    Best wishes to you and yours in the coming year. If you have any questions or would like to discuss your unique situation, call or email today. And please forward this newsletter to friends, family members and coworkers who may find the information helpful.


    Working for a Living: The Labor Market in 2012  


    The mantra “I’m taking what they giving ’cause I’m working for a living” was made famous in the 1980s by the band “Huey Lewis and the News.” Today, the feeling is the same around much of the country as many Americans were able to find work in 2011. But we’re not out of the woods yet, as many more workers are still searching for employment.

    The labor market made modest improvements in 2011, and that trend is likely to continue in 2012. As you can see in the bar graph next to this article, the number of new people claiming unemployment each week saw a drastic improvement by the year’s end compared to the high reported the last week of April 2011. Recently, the number of new claims has stayed below the important line of 400,000 new claims each week. That’s a welcome site compared to most of 2011.

    That said, it’s a good bet that the official Unemployment Rate will remain north of 8% throughout 2012, as more gains in the private sector are offset by government jobs being removed with our belt tightening measures. Another factor to consider is that Baby Boomers who are headed into retirement will be removed from the labor force, and this continuing shift in our country's demographics will help add to the decline in the unemployment rate.

    Rather than looking at the official Unemployment Rate, which always brings up controversy due to its methodology, we should start looking at the labor force’s "participation rate," as this may be a more accurate reflection of labor market conditions. This rate is a little more straightforward, since it simply measures the number of people eligible to work against the number of people actually working.

    And get this: the current labor force participation rate is 64%, which represents the lowest level of eligible workers participating in roughly thirty years. One of the contributing factors to the decline in the rate is the aforementioned effect of the Baby Boomer generation retiring and leaving the labor force. However, that only makes up a portion of the decline in the rate as obviously, there are still lots of folks looking to "participate" in the workforce, but they haven't been able to find a job. With businesses still somewhat reticent to hire until they feel more confidence, estimates are for little to no improvement in the participation rate in 2012.

    This is obviously a very important topic not only for people looking for work but also for the economy as a whole. I will continue to monitor the labor market and its impact on housing and home loan rates over the coming weeks and months.


    Home Sweet Home  


    On the one hand, the housing market still remains uncertain. For instance:

    • Foreclosures will still be a concern in 2012 as a fresh wave will be hitting the market…and that will prevent a broad-based pricing recovery in housing. However, the good news is that the delinquency rates have declined and should continue to do so.
    • While some parts of the country are seeing signs of improvement in housing, others continue to struggle. Overall, home prices will likely decline modestly in the first half of 2012 and then recover in the second half of the year.
    • Rentals and investment properties will continue to be popular in 2012 as more people continue to rent.

    On the other hand, we are closer to the bottom in housing and with historically low rates in 2012, it will be another incredible purchase opportunity for homebuyers.

    In fact, it looks like home loan rates could move a leg lower in the first part of 2012, as rumors continue to swirl around the possibility of the Fed stepping in with a third round of Quantitative Easing (or QE3), and this could lead to the lowest rates ever. HOWEVER…like all windows of opportunity, this one may be short as well. History has shown that Bonds move higher in anticipation of Quantitative Easing, but then selloff once the official announcement is made. Think about the old investing adage: "Buy on the rumor, and sell on the news." So the best home loan rates may be seen leading up to any actual announcement.

    If the Fed doesn't do QE3, rates will still be very attractive in the first part of year, before moving a bit higher in the second half of 2012 as the economy continues to pick up. Overall, the early part of 2012 looks to be a great environment for interest rate, which means lots of opportunity for homebuyers.

    Regardless of what happens at the Federal level, I’ll be here ready to help you get the best home loan for your unique goals and situation. And if you have any friends or family members who could use some insight and help navigating a home loan, please forward them this newsletter along with my contact information. I’m always happy to help out in any way I can.


    What to Watch: A Breeze of Inflation  


    Inflation, as measured by the Core Consumer Price Index, ran at 2.2% from November 2010 through November 2011. That was up rather sharply from the previous year and was closing in on the comfort range threshold of the Fed. What is interesting and a little disturbing to note is the increasing consumer inflation in the face of stagnant wage growth. Typically, consumer inflation increases are fueled by wage-based inflation, where wages move higher…but we are not seeing that just yet.

    With US consumers still behaving conservatively, the political climate promoting uncertainty and the labor market only making modest improvement, inflation may still tick higher to possibly 2.5%. But that would still be considered within the tolerance limits of the Fed.

    Of course, even if the inflation number is within the Fed’s comfort, any increase can negatively impact home loan rates. Remember: inflation is the archenemy of Bonds and home loan rates, so inflation ticking higher would not be good for rates. But inflation (and its impact on rates) doesn't exist in a bubble or an isolated test tube. Home loan rates are also impacted by other economic factors. Part of the magic in watching rates and how they behave is understanding all the competing factors at play. So the coming year will be an example of why it’s so important to work with a knowledgeable mortgage professional like me, who understands the complexity of the markets and can help identify opportunities for homebuyers.

    As always, I’ll be watching the inflation news closely in the coming months…and I’ll continue to share any important news that may impact you or the economy as a whole. And if you ever have any questions, please just call or email.


    Q&A: The bottom line?  


    QUESTION:What’s the bottom line for 2012?

    ANSWER: The bottom line is that opportunity lies around every corner. For people looking to purchase a home, the abundance of affordable housing and historically low home loan rates will create a number of opportunities. And for those seeking to refinance, this may prove to be another year where you can move into a better mortgage.

    If you have any questions at all as we enter the new year, please call or email. It only takes a few moments to look at what’s going on and to discuss what it means to your unique housing and financial goals.

    Best wishes and happy New Year!


    Mortgage Success Source, LLC is the copyright owner or licensee of the content and/or information in this email, unless otherwise indicated. Mortgage Success Source, LLC does not grant to the recipient or distributor a license to any content, features or materials in this email. You may not distribute, download, or save a copy of any of the content except as otherwise provided in our Terms and Conditions of Membership, for any purpose.

    Equal Housing Lender          


    Posted via email from Sean La Rue's Posterous